Summer 2024
Volume 32 | No. 3
Market QuickTakes Q2 | 2024
The first half of 2024, in a presidential election year no less, has been characterized by significant gains in major stock indices, driven by strong performance in large-cap growth and technology stocks. Here are the key highlights:
- Nasdaq, S&P 500, Dow Jones Industrials, and MSCI World All-Cap indexes set multiple All-Time Highs in Q2
- Q2 was dominated by technology and large-cap growth stocks, which propelled the tech-heavy Nasdaq to an 8.3% gain for the quarter closing +18.1% YTD
- Benchmark S&P 500 gained 3.9% in Q2 finishing the First Half +14.5%
- Overall, First Half gains for stocks were solid despite a mixed Q2
- Dow Jones Industrials closed over 40,000 for the first time ever in May but dipped 1.7% in Q2 to finish +3.8% YTD
- Small-cap Russell 2000 and mid-cap S&P 400 slipped 3.6% and 3.8% respectively in Q2, finishing +1% and +5.3% YTD
- Stocks were mixed overseas as well in Q2, with the benchmark MSCI EAFE index dipping 1.4% and Emerging Markets gaining 4.4%, but both finished with solid First Half gains up 3.5% and 6.1%
- Markets continued reducing Fed rate cut expectations in Q2 to just 1 or 2 by year-end
- Stronger-than-expected economic news in Q2 further supported the soft-landing narrative
- Benchmark 10-year Treasury Note yield rose 0.16% to 4.36% in Q2, finishing well off its high of 4.70% in April
- The Bloomberg Aggregate Bond index rallied 1% in June to close Q2 down just 0.7% YTD
Past Performance is No Guarantee for Future Success
Market Review
Nasdaq and S&P 500 lead
in record setting Q2
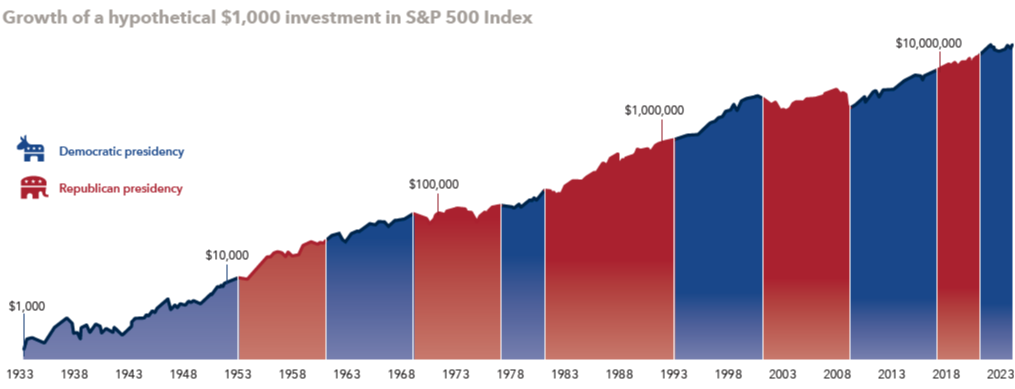
We have reached the Mid-Year point in a presidential election year. As we have noted numerous times and as our distinguished investment partners like Capital Group, Vanguard, Hartford Funds, and Dimensional Fund Advisors have illustrated, presidential election years have historically been positive. Though past performance is no guarantee for future results, the markets have followed suit ending Mid-Year 2024, and in record setting fashion no less.
Q2 saw numerous all-time highs for the tech-heavy Nasdaq and S&P 500. The benchmark S&P 500 has already set 31 all-time highs in 2024. The Dow Jones Industrials closed above 40,000 for the first time ever in May. The second quarter wasn’t without volatility; the market had a solid 4%+ pullback in April following a strong first quarter and warmer than expected inflation readings in February and March that further reduced Fed rate cut expectations causing interest rates to rise sharply.
In many ways, Q2 was a tale of two markets, with very strong gains for large-cap growth companies led by the Magnificent Seven coupled with negative returns for mid- and small-cap stocks. The same disparity can be said for growth versus value stocks and June was a microcosm of Q2 overall. The tech-heavy Nasdaq led the Q2 charge surging 8.3% and pushed its Mid-Year gain to 18.1%. The benchmark S&P 500 gained 3.9% in Q2 and closed June up 14.5% for the year. The market may have pulled forward some Second Half returns in these key areas and may not continue the blistering pace. On the other side of the market, the Dow Jones Industrials dipped 1.7% in Q2 but closed +3.8% YTD. Mid- and small-cap stocks struggled in Q2, with the S&P 400 and Russell 2000 falling 3.8% and 3.6% respectively, but still finished Mid-Year in positive territory +5.3% and +1.3% YTD.
Q2 was mixed overseas as well, with developed markets dipping 1.4%, as measured by the MSCI EAFE index, but remained up 3.5% YTD. However, the MSCI Emerging Markets index gained 4.4% in Q2 to close Mid-Year up 6.1%. The European Central Bank (ECB) cut policy rates by 0.25% in June, despite inflation remaining above its 2.0% target. This move gave the Fed cover for a similar move later this year, as well as the Bank of England (BOE).
The Bloomberg Aggregate Bond index’s 0.1% return would suggest a relatively boring second quarter. That would be far from the case as the benchmark 10-year Treasury note yield ranged from a high of 4.70% in April to a low of 4.22% in June, before ending Q2 at 4.36%. With the US economy continuing to surprise on the upside, strong job gains, and low unemployment further supporting the soft-landing narrative, warm CPI inflation numbers in February and March rattled the bond market and Fed rate cut expectations dwindled to just one or 2 by year-end. However, the bond market rallied in June with Bloomberg Aggregate Bond index gaining 1% to finish Mid-Year down just 0.7%.
The Outlook
Despite the impressive Mid-Year gains, the outlook for the second half of the year remains cautiously optimistic, with several key factors to watch:
- US Economic Growth: Continues to outpace other G7 economies with low recession risk.
- Corporate Earnings: Expected to grow double digits year-over-year for 2024 and 2025, supporting current valuations.
- Market Broadening: Anticipation of a broader distribution of market returns.
- Overseas Valuations: Remain attractive compared to US stocks.
- Bond Market: May yet post solid returns for 2024 given attractive yields.
- Inflation: Slight easing in Q2, with continued monitoring of inflation and interest rate trends.
- Job Market: Remains strong but saw a slight uptick in unemployment in May and June, though unemployment remains very low overall.
- Federal Reserve: Market expectations are for one to two rate cuts by year-end and more aligned with the Fed’s projections.
- Market Volatility: A near-term pullback would be normal after strong first half gains; volatility is expected to increase as the presidential election approaches.
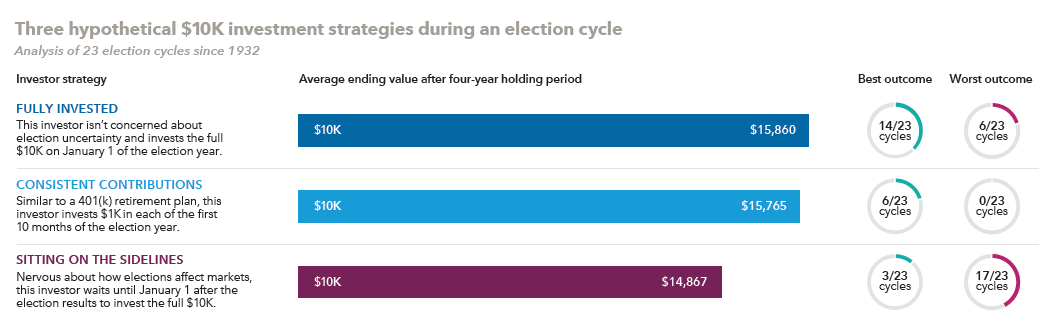
- Maintain Long-Term Focus: Look beyond the presidential elections for your investment portfolio.
Key Takeaways
- The market has shown resilience despite changes in Fed rate cut expectations and volatility.
- Large-cap growth and technology stocks have driven gains, while smaller-cap and value stocks have underperformed.
- The US economy’s strength supports the outlook, though inflation and interest rates remain key variables.
- Historical trends suggest that presidential election years are often positive for markets, though this is not guaranteed.
Conclusion: The Mid-Year performance in 2024 has been strong, at least from the large-cap perspective, which represents 70% of the total US market, and overseas markets have been solid as well. While there are risks and uncertainties ahead, particularly the November Election, the overall outlook remains positive with several supportive factors in place for the second half of the year.
During periods of uncertainty and volatility, it is important investors:
- Remain well-diversified
- Maintain discipline and patience
- Focus on the long-term
- Review your Risk Tolerance
Call your Nelson Advisor today at 800-345-7593 to discuss any concerns and review your portfolio.
~Your Nelson Securities Team
*Past Performance is No Guarantee for Future Results
Investing in an Election Year
How to invest with confidence in an election year
Our partner, Capital Group notes: U.S. voters will have their say in November 2024, but by maintaining a long-term focus, investors can position themselves for a brighter future regardless of the outcome at the voting booth. In fact, overreacting to short-term volatility during election cycles can be detrimental to investment returns.
Which political party has been better for investors?
Capital Group: Investing during an election year can be tough on the nerves, and 2024 promises to be no different. Indeed, politics can elicit strong emotions and biases, but investors would be wise to tune out the noise and focus on the long term.
That’s because elections have, historically speaking, made essentially no difference when it comes to long-term investment returns. What should matter more to investors is staying invested. A $1,000 investment in the S&P 500 made when Franklin D. Roosevelt took office would have been worth over $21 million as of December 31, 2023. During this time there have been eight Democratic and seven Republican presidents.
Current economic and political challenges may seem unprecedented but a look at past election cycles shows that controversy and uncertainty have surrounded every campaign. And in each case the market has continued to be resilient over time. Successful investors stay the course and rely on time in the market rather than timing the market.

Sources: Capital Group, RIMES, Standard & Poor‘s. Chart shows the growth of a hypothetical $1K investment made on March 4, 1933 (the date of Franklin D. Roosevelt’s first inauguration) through December 31, 2023.
Dates of party control are based on inauguration dates. Values are based on total returns in USD. Shown on a logarithmic scale.
Past results are not predictive of results in future periods.
What have been the best ways to invest in election years?
Capital Group Spoiler alert: The best way to invest in an election year has rarely been by staying on the sidelines.

Sources: Capital Group, Board of Governors of the Federal Reserve System (US), RIMES, Standard & Poor’s. The three hypothetical investors each have $10K to invest during an election cycle and are invested in a combination of equities and cash at all times. fully invested is always fully invested in equities. consistent contributions starts with $1K in equity and $9K in cash. At the start of each of the next nine months, this investor reduces cash by $1K and makes a $1K contribution to equities, after which they will have made the full $10K contribution to equities. sitting on the sidelines is entirely invested in cash during the first year. At the start of the second year, this investor reduces cash by $10K and makes a $10K contribution to equities. S&P 500 Index used for equity returns, and returns reflect the reinvestment of dividends. 3-month Treasury Bills used as a proxy for cash returns, and returns reflect the reinvestment of interest. Returns and portfolio values are calculated monthly and in USD. Analysis starts on January 1 of each election year and reflects a four-year holding period.
Past results are not predictive of results in future periods
Key Takeaways...
As our partners at Capital Group stress, it is important for investors to keep their eyes past the presidential election and further down the road.
Key Takeaways from Capital Group's Guide to Investing in Election Years:
- Election results have had very little impact on long-term investors.
- History shows that markets have risen whether a Republican or Democrat has been in office.
- Markets have been more volatile during primary season, but tended to rise strongly
thereafter. - It’s important to stay the course through primary season to benefit from any potential rally
once the final candidates and eventual winner emerge. - Investors often sit on the sidelines during election years out of fear and uncertainty,
but that’s rarely a winning strategy. - Net asset flows into money market funds have been more than twice as high in election
years as in the year after an election. - Investors who were fully invested or made monthly investments did better than those
who stayed in cash. - The key is to avoid trying to time markets around politics.
Download the Full Capital Group Guide to Investing in Election Years
Click below:
Lit. No. MFGEBR-121-0124P Litho in USA CGD/JR/10204-S91136 © 2024 Capital Group. All rights reserved.
Financial Insights...
Why a Stock Peak isn't a Cliff
DFA (Dimensional Fund Advisors): Many investors may think a market high is a signal stocks are overvalued. However, they may be surprised to find that the average returns one, three, and five years after a new month-end market high are similar to those after months that ended at any level. This valuable DFA piece illustrates why it's important for investors to look beyond the market at any level.
Diversification Can Feel Disappointing
As we have long advocated, diversification is a cornerstone for successful investing. However, BlackRock illustrates that Diversification Can Feel Disappointing from year to year. For instance, US Large-Cap Growth stocks, like the Magnificent Seven, have dominated the performance of benchmarks like the S&P 500 in recent years. This can lead investors to question their discipline. Rest assured, BlackRock shows how a diversified portfolio may produce a better outcome for you long-term.
Organizing Your Financial Records
From our partners at MFS: Many people struggle every time they open their mail or email. They ask themselves, “Is this important? Do I need this? Should I keep it? Should I throw it away or delete it?” This Heritage Planning guide provides key pointers on Organizing Your Financial Records, for yourself, as well as loved ones, and beneficiaries.
All Content is CLIENT APPROVED. Most brochures, guides, and presentations, are in PDF (Adobe Acrobat Reader), Microsoft PowerPoint, or video formats, which may require downloading the applicable program or player to view.
Mutual Fund & Annuity Center
Direct Mutual Fund and Annuity Models are Updated Semi-Annually
Our Direct Mutual Fund and Annuity Models are supported 100% Online. Click on the Model Portfolio Allocations Button below to access our Portfolio Allocations page. Password: 1029
Set up an appointment today with your Nelson Securities, Inc. Representative to review your investment portfolio.
800-345-7593
NOTE: WAA Summer 2024 Model Portfolio Allocations Q3-Q4 2024 (Updated Jul-24: No Changes But Rebalancing to Target Model Allocations Recommended)
Investor Note
Mutual Fund and Variable Annuity investment strategies, which include investing in specific sectors, foreign securities (both developed and developing markets), high yield securities, or small and medium sized securities may increase the risk and volatility of the funds/sub-accounts. Changes in interest rates may affect the performance of fixed income (bond) funds; if rates increase, bond values decrease and vice versa. Investors should consider the investment objectives, risks, and charges and expenses of the Mutual Fund and/or Variable Annuity carefully before investing.
The Mutual Fund prospectus (and summary prospectus, if available) and Variable Annuity prospectus contains this and other information. Please read carefully before investing. A Mutual Fund prospectus and Variable Annuity prospectus and contract can be obtained by calling your Nelson Rep at 800-345-7593 or the Mutual Fund and/or Annuity company directly.
Publisher: Nelson Securities, Inc.
The WEALTH ASSET ADVISOR is published quarterly by Nelson Securities, Inc., a Registered Investment Advisor. All rights reserved. It is a violation of U.S. copyright laws to duplicate or reproduce any article or portion of this publication without the written permission of the publisher.
Information and historical market data contained within this newsletter are taken from sources we believe to be reliable but, we can not guarantee its accuracy. Nelson Securities, Inc., or the publisher, will not be held responsible for actions taken based wholly or partially on information contained herein. Recommendations are of a time-sensitive nature and not a substitute for a comprehensive plan for investing. Each investor must consider suitability with regard to risk prior to investing.
