Broker Check

Wealth Asset Advisor

Spring 2025 | Volatility Edition
Volume 33 | No. 2

Market QuickTakes Q1 | 2025

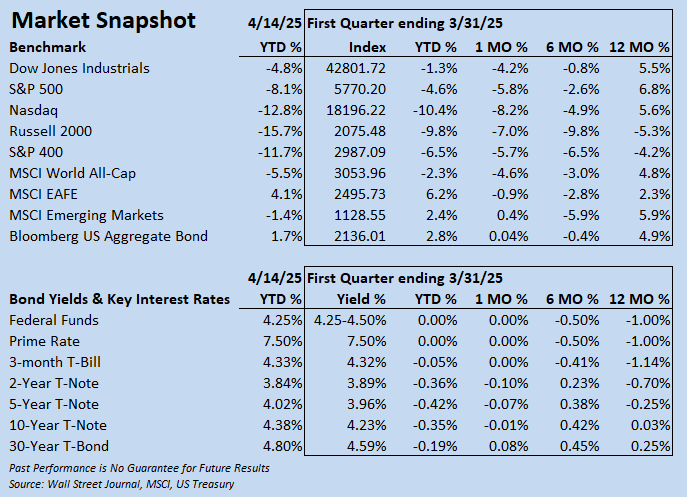
The First Quarter of 2025 began with promise but ended with heightened uncertainty. After a rocky start continuing December's slide, equity markets rebounded in mid-January. Buoyed by post-election optimism, the S&P 500 surged to new record highs ahead of President Trump’s inauguration and extended gains through most of February.

However, sentiment shifted sharply in late February as market volatility spiked to levels not seen since Q3 2022. Concerns around slowing economic momentum, rising inflation expectations, and the looming threat of Trump-era tariffs led to a marked increase in recession risks.

Key Q1 Highlights:

  • Equity Performance Divergence: The Dow Jones Industrial Average was the relative outperformer, ending Q1 down just 1.3%. In contrast, the S&P 500, Nasdaq, Russell 2000, and S&P 400 all experienced 10%+ corrections from YTD highs. The tech-heavy Nasdaq led declines, closing Q1 down 10.4%. Full Q1 Market Returns can be found in the Market Snapshot Chart. 
     
  • Style & Sector Rotation: Large-Cap Value stocks outpaced Large-Cap Growth in Q1, a full reversal from 2024’s trend dominated by the Magnificent Seven.

  • Volatility and Policy Concerns: March was dominated by a slew of executive actions from the Trump administration, including policy reversals, agency disruptions, and widespread layoffs in the DOGE government sector, as well as rising geopolitical tensions. These actions amplified investor anxiety, pushing the Economic Policy Uncertainty Index to its highest level since the 2008-2009 financial crisis.

  • Global Outperformance: International equities were a bright spot. The MSCI EAFE index climbed 6.2% and MSCI Emerging Markets rose 2.4%, boosted by a 4% decline in the US dollar, which enhanced returns for dollar-based investors.

  • Fed Policy Steady: The Federal Reserve maintained its target rate at both Q1 FOMC meetings and reaffirmed its outlook for two rate cuts in 2025. Policymakers cited continued uncertainty surrounding tariffs, persistent inflationary signals, and decelerating growth.

  • Bond Market Support: A flight to safety drove strong gains in fixed income. The Bloomberg Aggregate Bond Index rose 2.9% and the 10-year Treasury yield fell 0.35% to close Q1 at 4.23%, providing a much-needed buffer to diversified portfolios.

April Market Update: A Rapid Turn in Sentiment

Volatility re-accelerated in early April after President Trump’s April 2 tariff announcement, which went beyond worst-case expectations and stoked fears of a global trade war. Recession concerns surged and market volatility reached levels last seen at the onset of the COVID-19 pandemic. Recession risk in January was as low as 10% for 2025 with an economic soft-landing the prevailing base case but has now risen to 35%-50%+ by leading forecasters.

  • Global Ripples: International markets, which had delivered strong Q1 gains, also felt the impact—highlighting the deep interconnectedness of global markets.

  • Bond Market Reversal: The strong bond rally from March reversed course as Treasuries came under pressure post-tariff announcement, sending yields higher and exposing the vulnerability of the “safe haven” trade to policy-driven inflation risks. Overnight April 8, Treasury yields surged over 4.5% on a confluence of concerns including spiking recession risks.

  • Temporary Relief: On April 9, President Trump announced a 90-day pause on reciprocal tariffs, excluding China, following the overnight selloff in US Treasuries. Markets responded with one of the strongest single-day rallies on record, partially recovering losses from the prior week. Stocks finished solidly positive for the week and continued with gains on Monday, April 14, following reciprocal tariff carve-outs for the technology sector over the weekend. The bond market calmed as well, with yields edging lower.  


Looking Ahead: Volatility Remains the Constant

We continue to emphasize patience and discipline in this uncertain environment. With geopolitical and policy developments evolving rapidly, maintaining a long-term perspective and diversified positioning remains key to navigating the current market landscape.

Full Q1 Market Commentary click here

Financial Insights...

How to Handle
Market Declines

Capital Group: "We don’t know what the rest of this year will bring. But smart investing can overcome the power of emotion by focusing on relevant research, solid data and proven strategies. Here are seven principles that can help fight the urge to make emotional decisions in times of market turmoil."

1.  Market declines are part of investing
2. Time in the market matters, not market timing
3. Emotional investing can be hazardous
4. Make a plan and stick to it
5. Diversification matters
6. Fixed income can help bring balance
7.  The market tends to reward long-term investors

Get all the details, charts, insights on How to Handle Market Declines from Capital Group below.

Read Now

10 Things You Should Know About Market Volatility

Hartford Funds: Volatility is part of the investment experience, but the longer an investor holds stocks, the greater the potential for an overall positive return.

Highlights:

  • Put points in perspective - As market index values have grown over the years, a 100 point move in the Dow today is much different than what is was at 10,000. Think in percentage terms for volatility perspective.
  • Long-Term Investors Have Historically Seen Less Volatility - Lengthening time horizons from 1-year, to 5- and 10-year rolling time periods illustrates the increasing success rate of positive stock returns, from 76% (1-Yr), to 90% (5-Yr), to 97% (10-Yr). 

This Hartford Funds piece provides valuable insight into market volatility and how to stay focused long-term.

Past Performance is No Guarantee for Future Success

Read Now

Timing the Market
is Impossible

Hartford Funds: In times of volatility, Timing the Market may seem tempting, but doing so could cost you.

A historical perspective of the market shows us a pattern of bull and bear markets that may be tempting to investors. Why not try to time the market and avoid those short-lived bear markets? Wouldn’t that be more lucrative? Unfortunately, it’s impossible and could be a costly mistake.

Did you know?

  • 50% of the market's Best Days happen in Bear Markets?
  • 28% of the Best Days happen during the First Two Years of Bull Markets
  • 22% of the Best Days happen during the rest of Bull Markets

Get all the details in this valuable piece on the perils of trying to Time the Market below.

Read Now

Investment Principles for Navigating Volatility

While market volatility is common and part of long-term investing, it comes in many forms, severity, and duration. Knowing and understanding market volatility doesn't make it any easier to go through when it escalates, regardless of catalyst, even for seasoned professionals. We draw on experience and a foundation of Investment Principles for Navigating Volatility to weather the storms and help our Valued Clients reach their long-term investment destination. 

The following are just a few of the key Investment Principles to help investors ground their anxiety and concerns to help focus on the long-term, knowing each and every market pullback, correction, and bear market in history has not only recovered but gone on to new All-Time Highs.

View (and Save) the Full Co-Branded Investment Principles for Navigating Volatility (Click Here) PDF from our investment partners Dimensional and Nelson Securities.


A History of Market Up and Downs

Going back to 1926, the US stock market (as measured by the S&P 500) has experienced many Bull Markets and Bear Markets, as well as pullbacks (5%-10%) and corrections (10%+). This chart illustrates that while Bear Markets of 20% or more occur about every six years (Capital Group 1954-2024), they are much shorter in duration (months) and less severe on the downside than Bull Markets are in duration and cumulative positive returns on the upside.  


Distribution of Market Returns

Looking at the CRSP Index from 1926-2024, which measures the Total US Stock Market (NYSE, AMEX, and Nasdaq listed securities), US Stocks have had 74 Positive Years and and 25 Negative Years. In other words, historically, the Distribution of Returns for the US Stock Market has been positive about 75% of the time, which has benefitted long-term investors.
Past Performance is No Guarantee for Future Success

Reacting Can Hurt Performance

While making dramatic changes to your portfolio in reaction to extreme volatility (up and down) can provide short-term comfort and anxiety relief, history has shown that it can be costly for your long-term investment performance. This chart illustrates how Missing Only a Few Days of Strong Returns can drastically impact overall performance.


Intra-year Gains and Declines vs. Calendar Year Returns  

How a Calendar Year for the market ends is often very different than the Intra-Year Gains and Declines may suggest. The chart below illustrates that even the best Calendar Years can have large Intra-Year declines. Patience and discipline is required at all times during any given year for long-term investment returns to be realized. 


Years after Market Declines of More than 10% can be rewarding 

Market declines of 10% or more will grab any investor's attention, despite occurring about every 18 months (Capital Group) and fairly common. The chart below illustrates the 1-Year, 3-Year, and 5-Year Look Ahead Periods for the S&P 500 following Declines of More than 10% from January 1926 to December 2024. While Past Performance is No Guarantee for Future Success, patient and disciplined investors have been rewarded historically following market corrections. 


Diversified Portfolios can provide a Reduction in Volatility

Diversification is one of the key principles in Navigating Volatility. Whether it includes adding International, Growth and Value, or Small- and Mid-Caps to your Stock portfolio, or Bonds in your Asset Allocation to reduce overall volatility, Diversification is essential. Diversification does not prevent losses or ensure gains, but it can reduce overall risk and help with long-term investment results.

One of the tenants of investing is Risk and Return. The higher risk you take, the higher return potential you have over the long-term; however, your risk of loss and volatility is also higher, especially in the short-term.

This chart from Vanguard, illustrates how exposure to Bonds can help lower overall Portfolio Volatility, while also reducing overall return potential.  

Sources: Vanguard Investment Advisory Research Center calculations through December 31, 2024, using data from FactSet. Notes: Stocks are represented by the Standard & Poor's 90 Index from 1926 through March 3, 1957; the S&P 500 Index from March 4, 1957, through 1974; the Wilshire 5000 Index from 1975 through April
22, 2005; the MSCI U.S. Broad Market Index from April 23, 2005, through June 2, 2013; and the CRSP U.S. Total Market Index thereafter. Bonds are represented by the S&P High Grade Corporate Index from 1926 through 1968, the Citigroup High Grade Index from 1969 through 1972, the Lehman Brothers U.S. Long Credit AA Index from 1973 through 1975, the Bloomberg U.S. Aggregate Bond Index from 1976 through 2009, and the Bloomberg U.S. Aggregate Float Adjusted Bond Index thereafter. When determining which index to use and for what period, we selected the index that we deemed to fairly represent the characteristics of the referenced market, given the available choices. Past performance is not a guarantee of future returns. The performance of an index is not an exact representation of any particular investment, as you cannot invest directly in an index.


Be sure to discuss your Risk Tolerance, Diversification, and Asset Allocation with your Nelson Securities Representative.

Call Today: 800-345-7593 


Past Performance is No Guarantee for Future Results.


All Content is CLIENT APPROVED. Most brochures, guides, and presentations, are in PDF (Adobe Acrobat Reader), Microsoft PowerPoint, or video formats, which may require downloading the applicable program or player to view.

Mutual Fund & Annuity Center


Direct Mutual Fund and Annuity Models are Updated Semi-Annually

Our Direct Mutual Fund and Annuity Models are supported 100% Online. Click on the Model Portfolio Allocations Button below to access our Portfolio Allocations page. Password: 1029

Set up an appointment today with your Nelson Securities, Inc. Representative to review your investment portfolio.

800-345-7593

NOTE: WAA Spring 2025 Model Portfolio Allocations Q1-Q2 2025 (Updated Jan-25: Direct Mutual Fund and Annuity Models Updated) 

Model Portfolio Allocations

Investor Note


Mutual Fund and Variable Annuity investment strategies, which include investing in specific sectors, foreign securities (both developed and developing markets), high yield securities, or small and medium sized securities may increase the risk and volatility of the funds/sub-accounts. Changes in interest rates may affect the performance of fixed income (bond) funds; if rates increase, bond values decrease and vice versa. Investors should consider the investment objectives, risks, and charges and expenses of the Mutual Fund and/or Variable Annuity carefully before investing.

The Mutual Fund prospectus (and summary prospectus, if available) and Variable Annuity prospectus contains this and other information. Please read carefully before investing. A Mutual Fund prospectus and Variable Annuity prospectus and contract can be obtained by calling your Nelson Rep at 800-345-7593 or the Mutual Fund and/or Annuity company directly.

Publisher: Nelson Securities, Inc.

The WEALTH ASSET ADVISOR is published quarterly by Nelson Securities, Inc., a Registered Investment Advisor. All rights reserved. It is a violation of U.S. copyright laws to duplicate or reproduce any article or portion of this publication without the written permission of the publisher.

Information and historical market data contained within this newsletter are taken from sources we believe to be reliable but, we can not guarantee its accuracy. Nelson Securities, Inc., or the publisher, will not be held responsible for actions taken based wholly or partially on information contained herein. Recommendations are of a time-sensitive nature and not a substitute for a comprehensive plan for investing. Each investor must consider suitability with regard to risk prior to investing.